
Level 1 · Lesson 3 · ~20 min
Candles: open, high, low, close, and what a wick says
Every chart in our posts is drawn with candles. Once you can read one candle, you can read a whole chart, the same way knowing letters lets you read words.
One candle, one slice of time
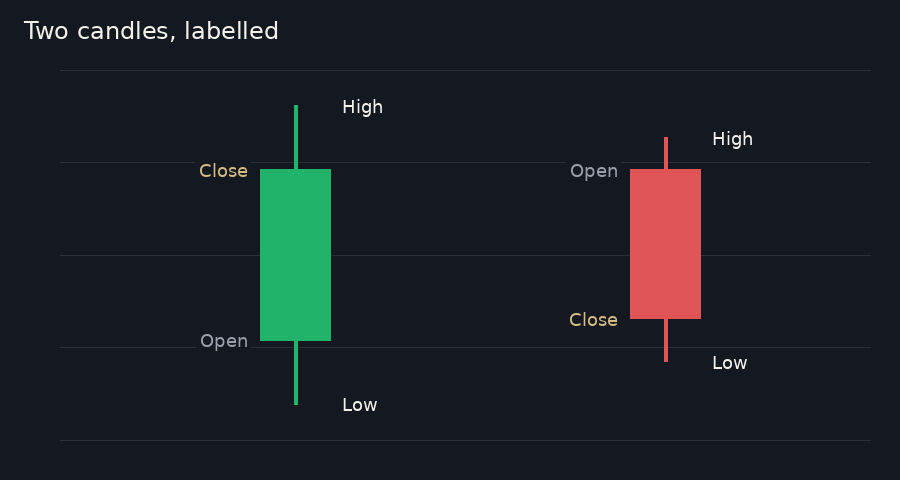
A candle sums up what price did during one slice of time. On a 5-minute chart, each candle covers 5 minutes. It records four prices:
- Open: the first price in that slice.
- High: the highest price reached.
- Low: the lowest price reached.
- Close: the last price when the slice ended.
The body: who won the slice
The thick part, the body, runs from the open to the close. If the close is higher than the open, the candle is usually green: buyers won that slice. If the close is lower, it is red: sellers won.
The wicks: where price went but didn't stay
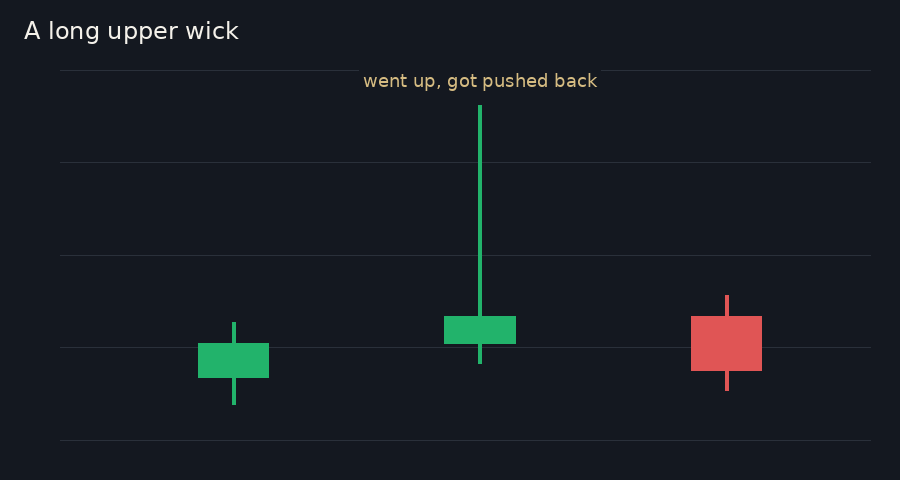
The thin lines above and below the body are wicks. They show how far price travelled during the slice and then came back. A long wick on top means price went up there, but sellers pushed it back down before the close. That is the rejection wick our posts mention.
Reading a few candles together
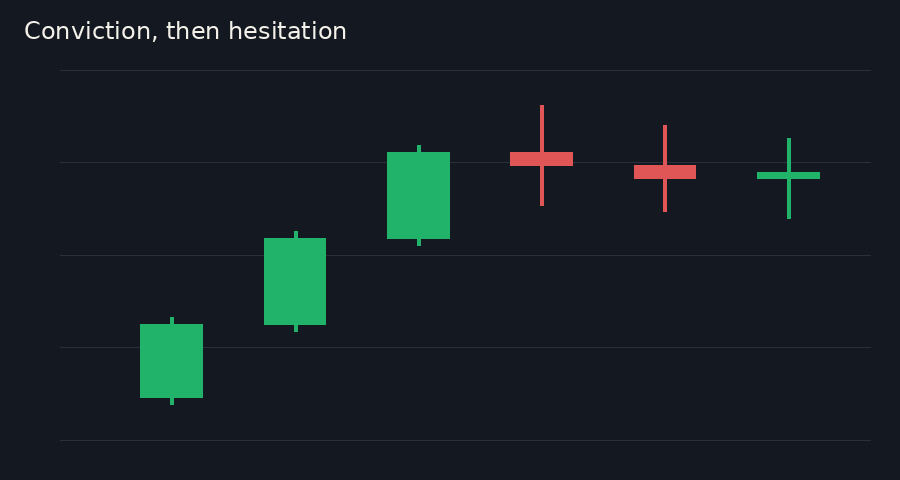
One candle is a word; a few in a row make a sentence. Tall bodies of the same colour, closing near their extremes, show conviction: one side firmly in charge. Small bodies with wicks on both ends show hesitation: the two sides are trading blows and nobody is winning yet.
In our posts: "Stall into R1: price pushed into R1 and the 5-min candle closed back inside it with a rejection wick or a lower high."
Now you can read that sentence: price reached an area, a candle's wick poked up into it, and the candle closed back below. Sellers showed up there.
Recap
- A candle shows four prices for one slice of time: open, high, low, close.
- The body shows who won the slice (green: buyers, red: sellers); the wicks show where price went but didn't stay.
- Big same-colour bodies mean conviction; small bodies with long wicks mean hesitation or rejection.