
Level 1 · Lesson 6 · ~20 min
Setting up a free simulator chart
Everything in this course is practised in a simulator: a practice account that uses real market prices with pretend money. This lesson covers why practice comes first, what to look for in a free platform, and how to mark up a chart the way the classroom does.
Why a simulator comes first
Learning to read a chart is like learning to drive. Nobody's first lesson is on the highway at rush hour. It's in an empty parking lot, where a mistake costs nothing.
A simulator is that parking lot. It offers three things:
- Repetition without risk. One morning can bring several chances to watch price reach the same area and see what it does there. Each visit is a practice rep.
- Room for mistakes. Mistakes are how anyone learns. In a simulator they cost points on a practice account and nothing more.
- An honest record. With nothing real at stake, it's easier to write down what you saw and what you'd do differently. That record becomes your practice journal.
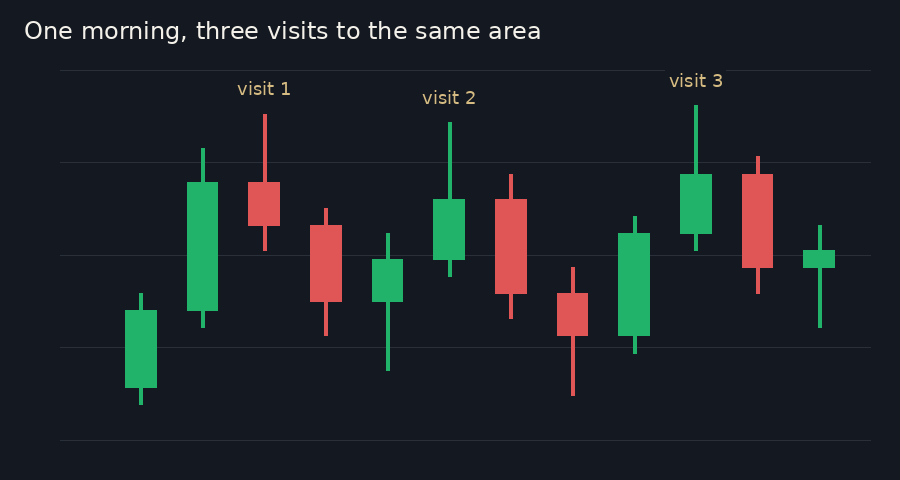
Real money changes how people think. Fear and excitement crowd out what they've learned. That's why this course stays in the simulator, and why the classroom's posts keep pointing to a simulator chart.
What to look for in a free platform
Nothing expensive is required. Most charting platforms and broker demo accounts offer a free tier that covers the basics. Four things matter:
- An NQ chart. Search for NQ or "E-mini Nasdaq-100". Some free sites show it as NQ1!, and some show prices a few minutes late, which is fine for practice.
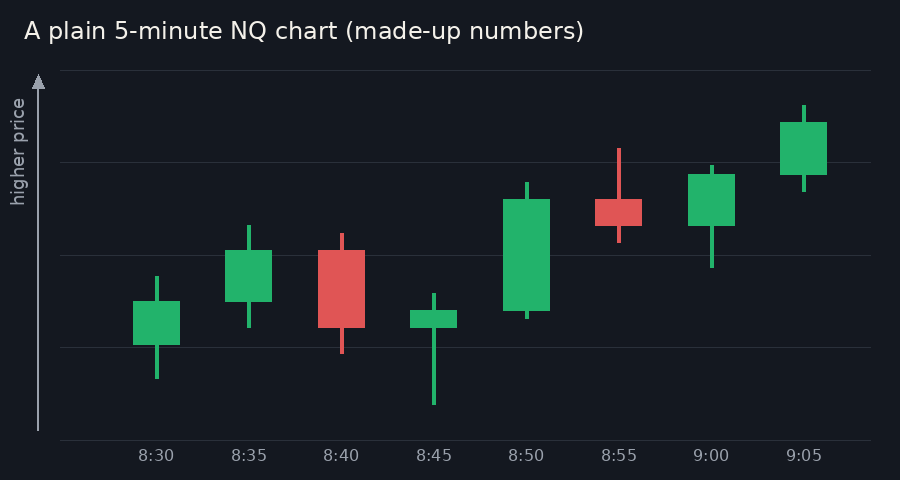
- 5-minute candles. The classroom's live posts read 5-minute candles. The 15-minute and daily charts are useful too.
- A tool for drawing boxes. Zones are areas, so a rectangle tool is the one that matters most.
- A paper account. It goes by many names: paper trading, demo, sim. It places practice orders against real prices with pretend money.
This lesson names no platform on purpose. The classroom doesn't recommend one, and any platform with these four things works.
A short setup checklist
- Open a free charting or demo account and check that it's a simulated (paper) account, not a live one.
- Load NQ and set the chart to 5-minute candles.
- Set the chart's time zone to US Central, so the times match our posts.
- If there's an option for extended or overnight hours, turn it on, so the Asia and Europe sessions show.
- Find the rectangle tool and practise drawing one box.
- Save the layout, so the chart opens the same way next time.
Labelling your chart like the classroom
Each lesson plan lists the day's zones: price areas where traders reacted before. Each zone has a name. R1, R2 and so on sit above price. R stands for resistance, an area where rising price has tended to stall. S1, S2 and so on sit below. S stands for support, an area where falling price has tended to hold. Level 2 explains how zones are built. For now, the job is to draw them.
A zone is a range, such as 30,760-30,775, so it's drawn as a shaded box rather than a single line. The box runs from the lower price to the upper price, stretches across the chart, and carries the zone's name. The classroom shades resistance red and support green. Any colours work, as long as they stay the same every day.
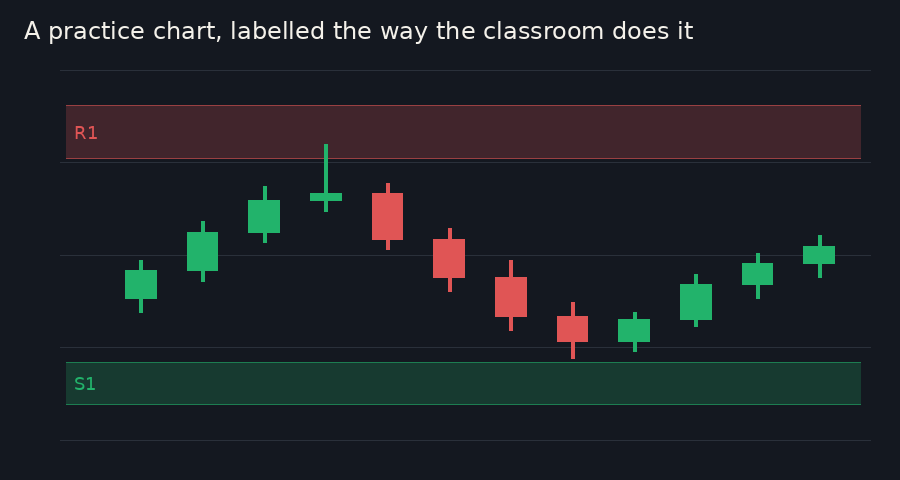
In our posts: "Homework before the open: draw these zones on your simulator chart. For each one, write down what you'd need to see before it counts as a setup, and where it's invalidated."
With the checklist done, the first half of that homework takes a few minutes: one box per zone and one name per box. The second half, what to look for and where an idea is proven wrong, is what Levels 2 to 4 teach.
Recap
- A simulator gives repetition without risk and an honest record; this course practises only there.
- A free platform works if it has an NQ chart, 5-minute candles, a box-drawing tool and a paper account.
- Zones are drawn as shaded boxes with their names (R above price, S below), the same way every day.