
Level 2 · Lesson 7 · ~20 min
Support and resistance are areas, not lines
Every lesson plan lists zones with names like R1 and S1. Those names come from two of the oldest ideas in trading: support and resistance. This lesson explains why price tends to turn where it turned before, and why the classroom marks those places as areas instead of lines.
Why price turns where it turned before
Imagine a house on your street sold for a certain price last spring. The neighbours remember that number. When the next house goes up for sale, that old price becomes a reference point: buyers compare against it, and sellers do too.
Traders remember prices in the same way. If price fell to a level and then climbed hard, the people who bought there remember a good decision. People who missed it remember a missed chance. When price comes back, both groups are paying attention, and some of them act.
There's a second, more mechanical reason. Many traders place their orders, instructions to buy or sell at a set price, ahead of time. When a lot of orders wait near the same price, they can soak up a move and turn it around.
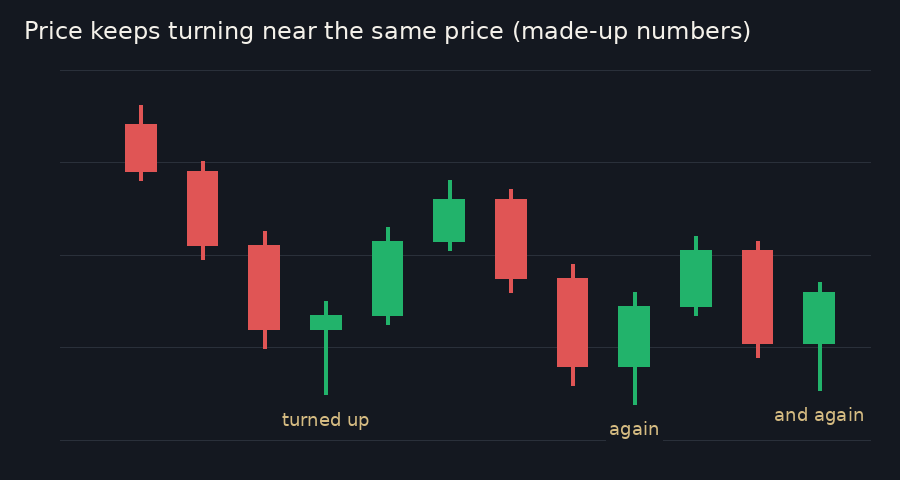
Neither reason is a law. They make a turn at an old price more likely, never certain. Each return visit is a test of whether the crowd still cares about that price.
Support below, resistance above
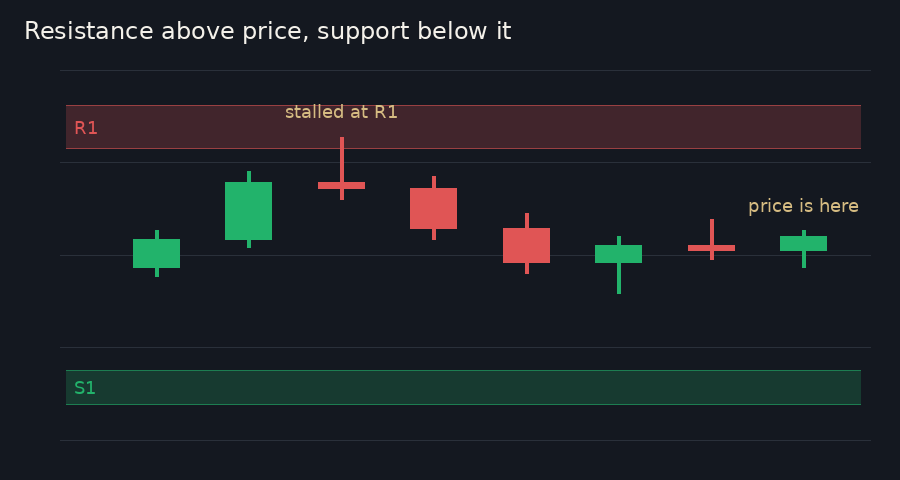
Support is an area below the current price where falling price has tended to stop and turn up. Think of it as a floor.
Resistance is an area above the current price where rising price has tended to stall and turn down. Think of it as a ceiling.
Which word applies depends on where price is right now. The same area can be resistance one day and support a week later, as the last section shows. That's why the classroom names zones by where they sit: R for resistance above price, S for support below.
An area, not a line
Price rarely turns at one exact tick. The waiting orders are spread over several prices, and a fast candle often overshoots by a few points before it turns. That overshoot shows up as a wick, the thin part of a candle from Level 1.
Draw a single line, and those wicks keep poking through it. The line looks broken when the area actually did its job. Draw a shaded box instead, and the same wicks land inside it or a little past it.
Think of the edge of a lake rather than a painted line. The water laps a little higher one moment and a little lower the next, but it's the same shore.
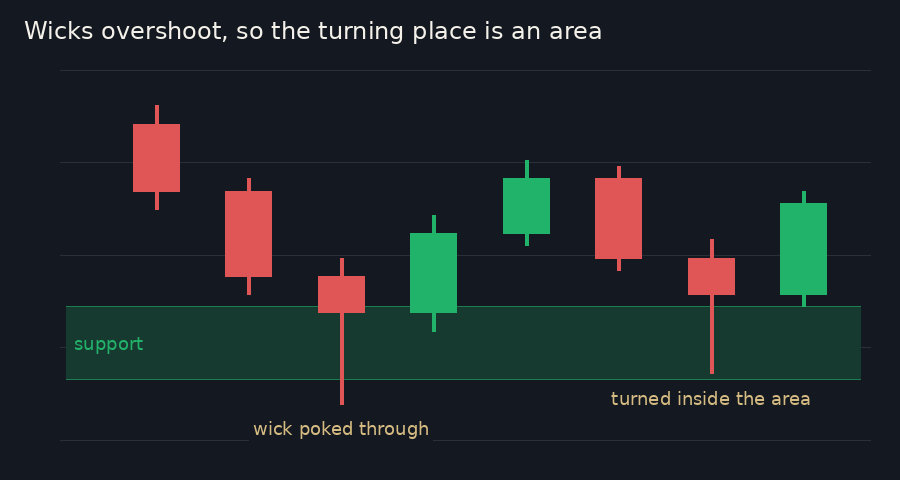
What matters most is where the candle closes. A wick through the area and a close back inside it means the area held. A close well beyond it is a different story, and Lesson 12 looks at that difference.
When support breaks: the flip
Sometimes price closes through support and keeps going. The area doesn't stop mattering. Traders who bought in that area are now holding positions worth less than they paid. If price climbs back up to it, some of them are glad to get out near their own price, and their selling can turn price down again.
So broken support often acts as resistance when price returns from below. The same works in reverse: broken resistance often acts as support. Traders call this a flip.
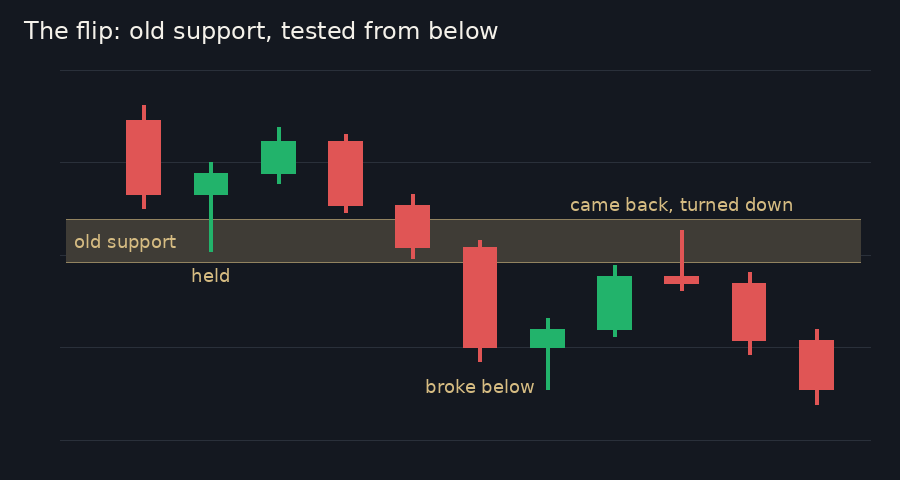
You'll see flips in our lesson plans. A support zone's description might list "Sep 29 daily high", an old high that price has since climbed above. A resistance zone above price might list "Oct 7 daily low", an old low that price has since fallen through.
In our posts: "Mark zones, not lines. Price rarely turns at one exact tick. A zone is the area where several reference prices cluster, usually 10 to 40 points wide."
That's the first step of the chart lesson posted before each session. Its fourth step names the flip: "A zone that breaks often acts from the other side later: old support becomes resistance and vice versa."
Recap
- Price often turns where it turned before, because traders remember those prices and orders wait there.
- Support is an area below price where falls have tended to stop; resistance is an area above price where rises have tended to stall.
- Zones are areas because wicks overshoot; a broken zone often works from the other side later, which is called a flip.