
Level 2 · Lesson 8 · ~20 min
How a zone is built
A lesson plan's zones aren't drawn by feel. Each one is built from a short list of reference prices: prices where traders reacted before, or prices that many people are watching. The list is gathered the same way every day, so with a little practice anyone can find the same prices on their own chart.
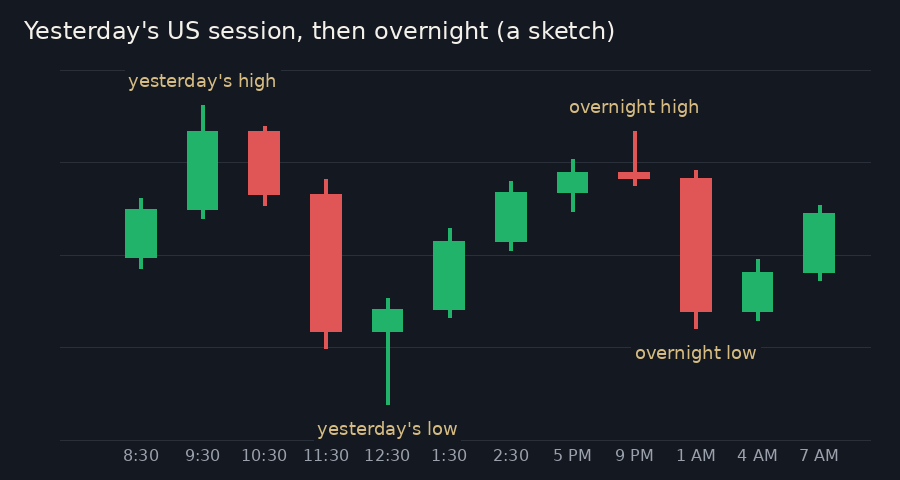
Yesterday and overnight
The first ingredients come from the most recent trading.
- Prior day high and low: the highest and lowest prices of yesterday's US session, 8:30 AM to 3 PM CT.
- Prior day close: the last price of that session.
- Overnight high and low: the highest and lowest prices since trading restarted at 5 PM, through the Asia and Europe sessions.
These prices mark the edges of where buyers and sellers agreed most recently. Almost every trader can see them, which is part of why they matter: a price that thousands of people have marked is a price where many of them will act.
Swing points and volume nodes
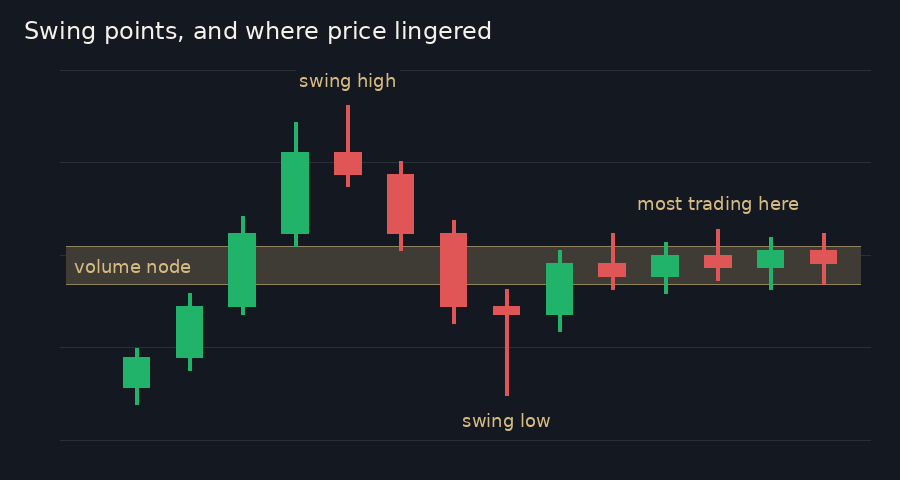
Level 1 called the turning points on a chart peaks and dips. The classroom's map makes them precise. A swing high is a candle whose high is above the highs of the three candles before it and the three after it. A swing low is the opposite: a low below the three candles on each side.
A swing point is where one side ran out of push and the other took over. That's the kind of place the crowd remembers.
The other ingredient is harder to spot. Volume is how many contracts changed hands. Price spends more time, and sees more trading, at some prices than at others. The price where the most trading happened during a session is its volume node.
Picture a park after fresh snow. By evening, one path is trodden flat because most people walked that way. The volume node is the most-trodden price of the session. Many traders hold positions from around there, so it often matters again when price returns.
Round numbers, and prices that crowd together
People like round numbers. Orders tend to gather at prices like 30,750 or 31,000, so the map adds a round number every 250 points. The thousands, like 31,000, count a little more than the others.
Now the list has a dozen or more prices, and some of them sit almost on top of each other. Those are merged. When reference prices sit within about 15 points of each other, they become one zone, running from the lowest of them to the highest.
Two limits keep zones useful. A zone is at least 8 points tall, so a small overshoot still lands inside it. And a group stops growing at about 40 points, so a long chain of nearby prices doesn't turn into one giant zone.
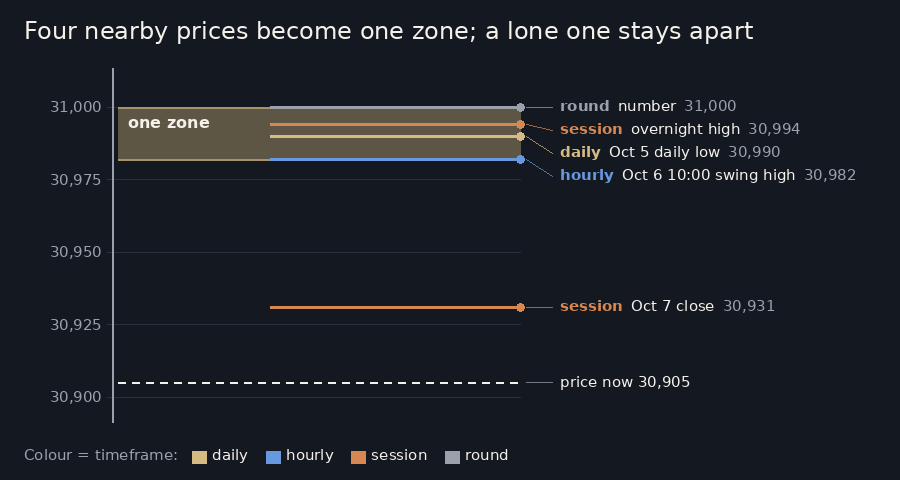
Each zone keeps a list of the reference prices that built it. The classroom calls that list the zone's role, and it appears beside the zone in every plan.
Naming: R1 and S1 are the nearest
Once the zones are built, each one gets a name based on where it sits compared with price at that moment.
Zones above price are R zones, for resistance. The nearest one is R1, the next one up is R2, and so on. Zones below price are S zones, for support. The nearest is S1, the next one down is S2.
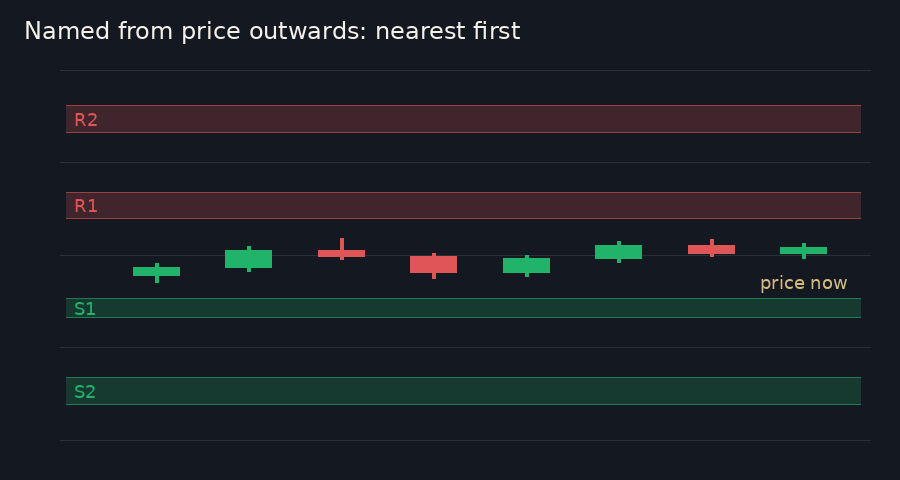
The numbers are about distance, not importance. R1 is the closest zone above, which isn't the same as the strongest. The next lesson covers how strong each zone is.
In our posts: "Work from the top timeframe down. Weekly highs/lows first, then daily highs, lows and closes, then 60-minute swing highs/lows, then yesterday's session and the overnight session."
That's the second step of the chart lesson. This lesson started at the bottom of that list, with yesterday and overnight, because those prices are the easiest to find. The next lesson climbs to the top of it.
Recap
- Zones are built from reference prices: yesterday's high, low and close, the overnight high and low, swing points, volume nodes and round numbers.
- Prices within about 15 points of each other merge into one zone, at least 8 and at most about 40 points tall.
- Zones above price are named R1, R2 and so on, below price S1, S2, always counting out from the nearest.