
Level 2 · Lesson 10 · ~20 min
Reading a lesson-plan post
Before each session, the classroom posts a 📒 lesson plan listing the day's zones and the patterns it will study. A little later comes a 🗺️ chart lesson with a picture of those zones and how they were found. Every part of both posts uses ideas from the last three lessons. This lesson reads them line by line.
The lesson plan, top to bottom
The lesson plan is scheduled before its session starts: 4:45 PM CT for Asia, 1:45 AM for Europe and 7:45 AM for the US. With round-the-clock sessions on, the post begins with the session's name, such as 🇺🇸 US, so it's clear which room it belongs to.
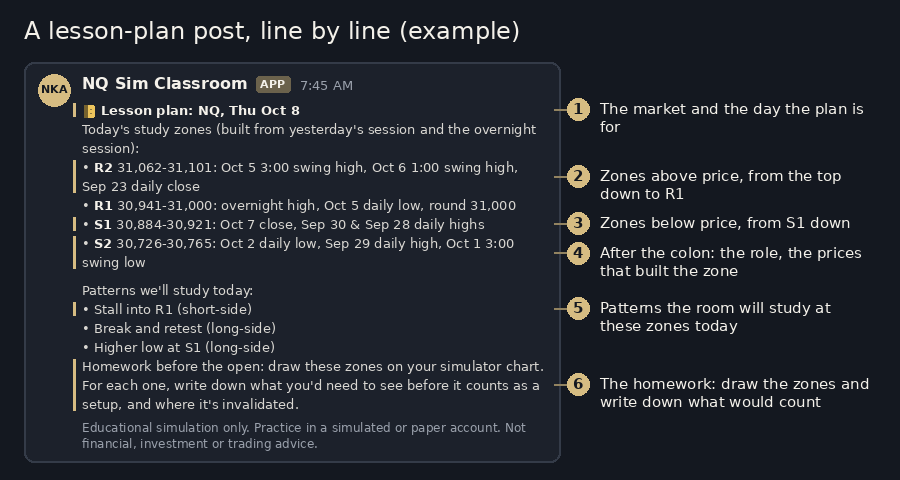
Line by line, it says:
- The header: the market, NQ, and the trading day the plan is for.
- The zones: listed from the top of the chart to the bottom. The R zones come first, highest to lowest, ending with R1. Then the S zones, starting with S1. So price sits in the gap between R1 and S1. The intro line mentions yesterday's session and the overnight session, but the zones also draw on the weekly, daily and hourly charts, as the last lesson showed.
- Each zone line: its name, its range from bottom to top in whole points, and after the colon its role, the reference prices that built it. "Oct 2 daily low, Sep 29 daily high, Oct 1 3:00 swing low" means a daily low, a daily high and a 60-minute swing low all landed in that area.
One zone line, piece by piece
The chart lesson lists the same zones and adds two things to each line: the strength and the tier from the last lesson.
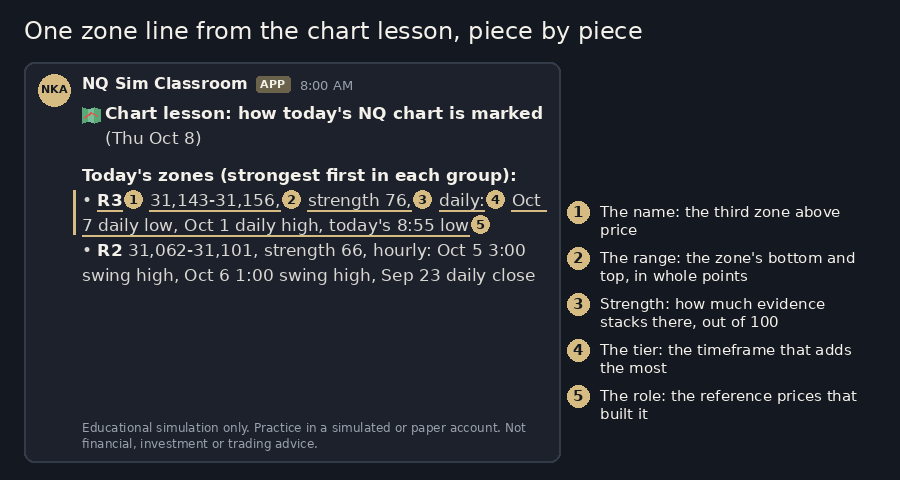
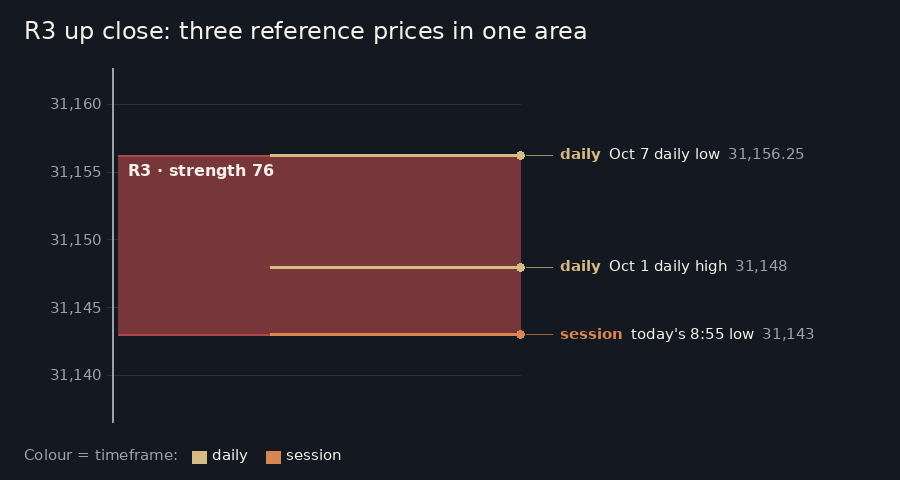
Read as a sentence, the R3 line says: the third zone above price, between 31,143 and 31,156, fairly strong at 76 out of 100, built mostly from the daily chart. Its reference prices are the Oct 7 daily low, the Oct 1 daily high, and this morning's 8:55 low.
There's a flip hiding in there, too. The Oct 7 daily low was a floor. Price has since fallen below it, so now it sits above price as part of a resistance zone.
Patterns and homework
The lesson plan's second list is "Patterns we'll study today". Each line names a pattern the room's watcher looks for at these zones today, such as "Stall into R1" or "Higher low at S1". Level 3 teaches each pattern in turn.
The word in brackets gives the direction the pattern studies. Traders call a position that gains when price falls short, and one that gains when price rises long. So a short-side pattern is about price falling away from a zone, and a long-side pattern is about price rising away from one. These are labels for study, not instructions.
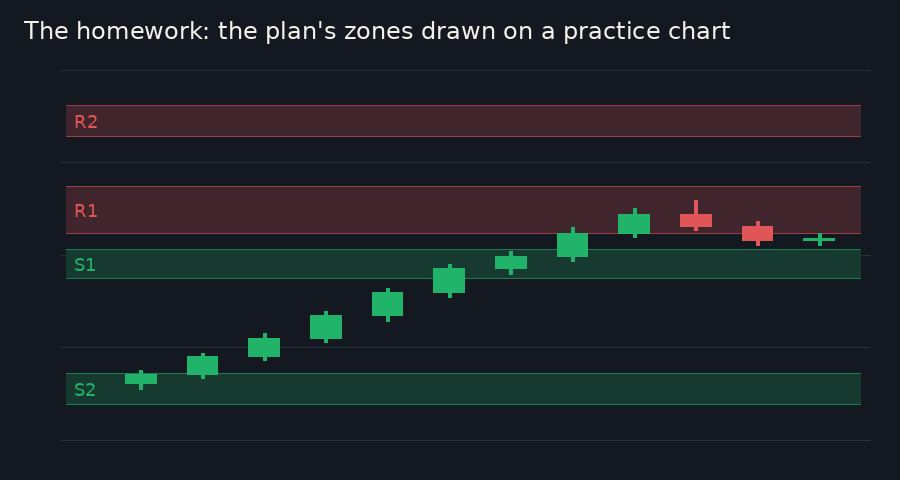
The last line is the homework. Drawing the zones takes a few minutes, as Level 1 showed. The second half asks two questions about each zone: what would need to happen there before it counts as a setup, meaning a pattern worth studying closely, and where is it invalidated, meaning which price would show the idea was wrong. Levels 3 and 4 answer those questions.
In our posts: "R3 31,143-31,156, strength 76, daily: Oct 7 daily low, Oct 1 daily high, today's 8:55 low"
That one line, from the chart lesson, now reads like a sentence: which zone, where, how strong, which timeframe, and what built it.
Recap
- The 📒 lesson plan lists zones from the top down, R zones then S zones, each with its range and its role; price sits between R1 and S1.
- The 🗺️ chart lesson adds each zone's strength (0-100) and tier.
- The patterns list names what the room will study at those zones, with a short-side or long-side label, and the homework asks what would count and where an idea is wrong.