
Level 2 · Lesson 11 · ~20 min
Trend, range and chop
The same zone can mean different things depending on what price has been doing on the way to it. Has price been climbing, falling, or bouncing between two areas? This lesson names those moods, and explains why the classroom treats the middle of a range as a place to wait.
Trend: a staircase
Level 1 described climbing price as a staircase of higher peaks and higher dips. Traders call that an uptrend: a run of higher highs and higher lows, where each swing high tops the last one and each swing low stops above the last one.
A downtrend is the same staircase upside down: lower highs and lower lows.
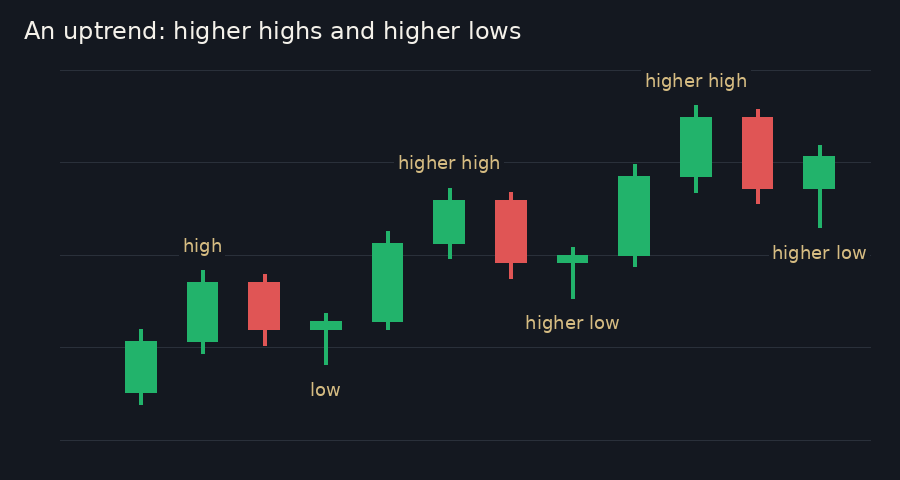
To check for a trend, a seasoned trader compares the last two swing highs and the last two swing lows. Both rising: uptrend. Both falling: downtrend. Anything else: no clean trend.
A trend usually ends quietly. The first clue is often a high that fails to beat the last one, or a low that breaks below the previous low.
Range: a box between S1 and R1
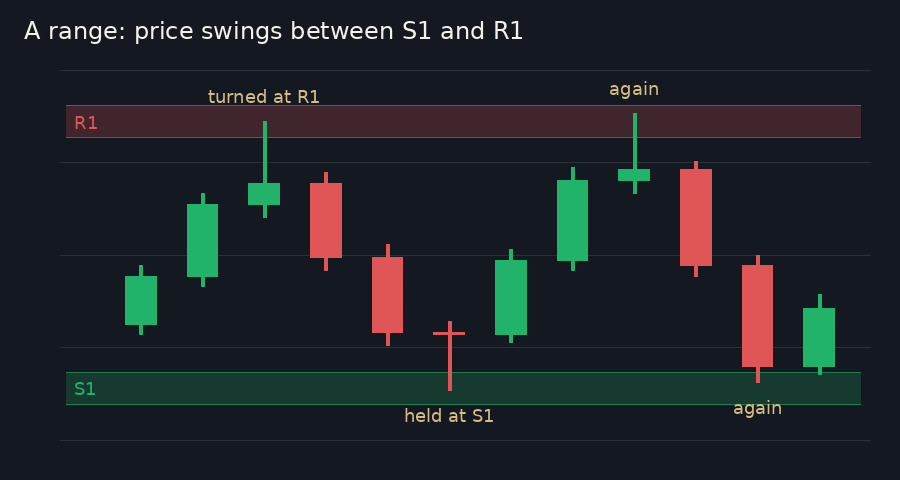
A range is price moving sideways between a ceiling and a floor. The highs keep stopping near the same area, and so do the lows.
In our posts, the ceiling and the floor are often the nearest zones: R1 above and S1 below. The edges of the range are where the interesting moments happen, because that's where price meets a zone and has to show what it'll do.
The middle of the range
The middle of the range is the space between the top of S1 and the bottom of R1. Price there is far from both edges.
Think of a tennis rally. The moments that tell you something happen at the baselines, where the ball turns. Mid-court, the ball is in flight, and guessing where it'll land is much harder.
The middle is hard for two reasons. First, there's no zone nearby to measure an idea against, so the price that would prove an idea wrong is a long way off. Second, small moves in the middle are often noise: they look like a start and turn out to be nothing.
So the classroom's study plan treats the middle as a no-new-position area: a place where the plan doesn't start anything new. When a 5-minute candle closes back inside the middle, it posts a WAIT. It only does this when the gap between S1 and R1 is at least 20 points, so there's a real middle to speak of.
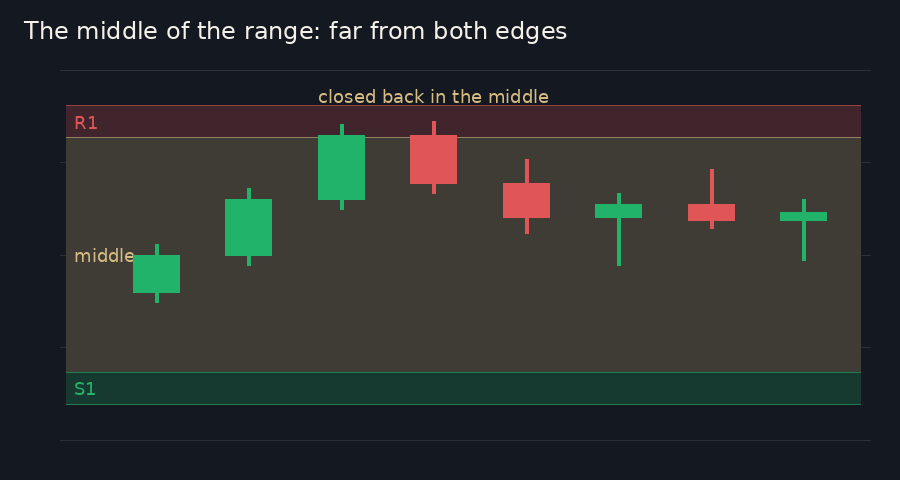
In our posts: "⏸️ Middle of the range. Price closed back between 30,921 and 30,941. In this study plan, the middle of the range is a no-new-position area. Study it as a pass."
"Study it as a pass" means watching what price does there without starting anything, then noting afterwards whether waiting was the right call. Level 4 has a whole lesson on why passing is a decision, not a missed chance.
Chop: why it punishes
Chop is price with no direction and no clean edges. Candles overlap each other, wicks stick out at both ends, and every push up or down fails within a few candles.
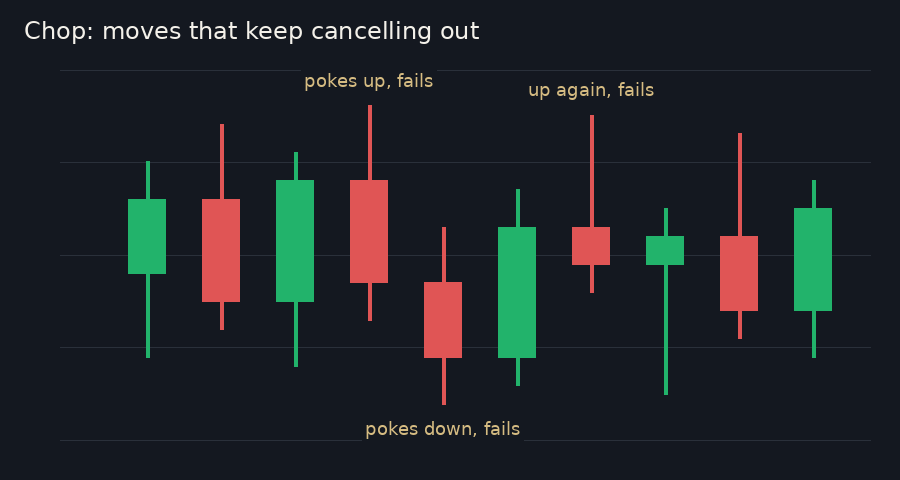
Chop is hard on anyone who acts on every move. Each push looks like the start of something, then reverses. Someone who follows it gets caught by the reversal; someone who bets against the next push gets caught when that one runs a little further. The points lost each time are small, but they add up, and so does the frustration.
Seasoned traders learn to recognise chop by its look: overlapping candles, wicks on both ends, and no progress. When they see it, they wait for price to reach an edge, or for the chop to end.
Recap
- An uptrend is higher highs and higher lows; a downtrend is lower highs and lower lows.
- A range is price swinging between a ceiling and a floor, often R1 and S1; the middle of the range is a no-new-position area in the study plan.
- Chop is overlapping candles with no direction; it punishes acting on every move, and seasoned traders wait it out.